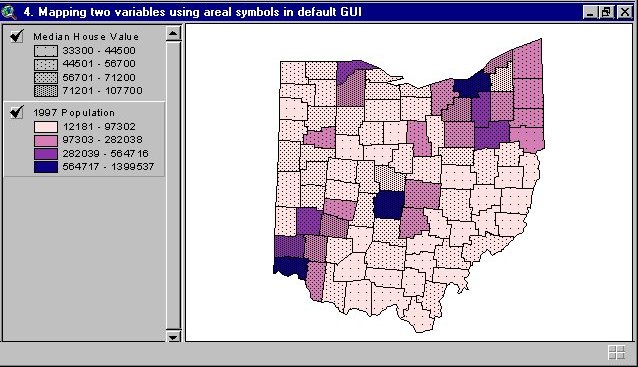
A bivariate choropleth map maps two different variables and compares them by creating different symbols for each variable. The map above is of Ohio and its areal units are done by county. The first variable is median house value and is shown by how many black dots are displayed in the county. The other variable is 1997 and is shown through color. Both are in interval of four. The purpose of this map is to see if the house value in Ohio counties is linked to the population in the counties.
http://proceedings.esri.com/library/userconf/proc99/proceed/papers/pap171/p171.htm
No comments:
Post a Comment